International Journal of Virtual Worlds and Human Computer Interaction (VWHCI)
ISSN: 2368-6103

Volume 2, Year 2014 - Pages 47-56
DOI: 10.11159/vwhci.2014.006
UX-Log: Understanding Website Usability through Recreating Users' Experiences in Logfiles
Chris Menezes, Blair Nonnecke
University of Guelph
50 Stone Rd E., Guelph, Ontario, Canada
cmenezes@uoguelph.ca; nonnecke@uoguelph.ca
Abstract - Web server log files are an inexpensive, automatically captured recording of a user experience (UX) on a website. In this paper, a tool, UX-Log, used logfiles to recreate users' experiences with the purpose of gaining usability insights. To evaluate the effectiveness and value of this, 10 usability experts watched recreated user experiences using UX-Log and were then asked to infer users' goals, strategies, successes or failures, and proficiencies; and afterwards, rate UX-Log across multiple dimensions. Both user experience recreation and UX-Log proved successful for gaining usability insights; usability experts were able to infer users' goals, strategies, successes or failures, and proficiencies. They were able to do this without training, without familiarity of the website, and without domain knowledge of the subject depicted in the user experiences. However, they were only able to infer users' overarching goal, not specific goal criteria, and were only able to determine relative proficiencies after viewing both user experiences. They also expended a good deal of mental effort trying to comprehend ambiguous user interactions, and identified needed improvement in the UX-Log interface.
Keywords: Usability, log file, web analytics, website, UX, user experience, user interface.
© Copyright 2014 Authors - This is an Open Access article published under the Creative Commons Attribution License terms. Unrestricted use, distribution, and reproduction in any medium are permitted, provided the original work is properly cited.
Date Received: 2013-11-13
Date Accepted: 2014-03-22
Date Published: 2014-05-30
1. Introduction
With the increasing use of [1] and dependence on websites [2], it is important that websites demonstrate good usability; defined as "[the] extent to which a system, product or service can be used by specified users to achieve specified goals with effectiveness, efficiency and satisfaction in a specified context of use" [3]. Two common methods for understanding the usability of a website are usability testing and web analytics.
In usability testing, individual users are observed and studied while interacting with the website [4]. Although it is a popular method, usability testing requires planning; can be expensive and time consuming; and may not provide results that accurately represent all usage [5].
In contrast, Web analytics uses recordings of user interactions (logfiles) to report on and graph aggregate website usage [6]. For example, when used on an e-commerce website, Web analytics can provide tables and graphs depicting website traffic and popular product pages. Unlike usability testing data, logfiles are automatically generated, inexpensive to use, and reflect actual usage [6]. However, Web analytics fails to convey individual usage and behaviour [7], which are important for understanding website usability, e.g., why and how a user navigates to a product.
The research described in this paper proposes a new method for understanding website usability and an alternative use of logfiles, i.e., using logfiles to recreate a user's experience on a website for the purpose of understanding individual usage and behaviour (namely a user's goals, strategies, proficiency, and successes or failures) and in doing so understand the usability of a given website.
2. Background
This section describes web server logs and how they are currently used in web analytics and concludes with a description of an alterative way of using logfiles for understanding website usability.
2.1. Web Server Logfiles
Web server logfiles are a recording of user interactions on a website [6]. They are automatically generated by the web server software hosting the website [8]. Whenever a user clicks on a clickable item on the website (such as a link), a request is sent to the web server, and new entries are recorded into the logfile [8]. A typical entry in combined log format resembles the following:
|
90.07.06.86 – hciguy
[15/Nov/2012:16:00:00 -0700] |
A single log entry like the one above details a user's IP address (allowing them to be uniquely identified, and identifies their geographic location); the date and time of their interaction (Nov 15th at 4pm), describes their interaction (index.html?search=routers is called a request and describes a search performed on the homepage for routers); indicates the prior website that referred them (www.google.com); and provides information on their web browser and computer (Macintosh running Mozilla version 5.0). Although a single log entry details only a user's single click, a series of log entries describes a user's visit to the website. For example, the series of requests can be used to follow the user's path through the website and identify interactions with content. The time difference between timestamps provides the duration between interactions.
2.1.1. Limitations of Logfiles and Barriers to Logging
Logfiles, however, are incapable of capturing all interaction information, such as a user's thoughts, intentions, gaze, voice, a visual of the user, time spent interacting with another website or program, time spent away from the computer, or network latency. In addition, logfiles are incapable of capturing cursor movements, clicks on non-clickable items, cursor-selected text, page scrolling, interactions with the Internet browser, and whether a link was opened in the same window or a new one. Logfiles also do not capture interactions with dynamic content such as AJAX or Flash, which do not send requests to the webserver and thus do not prompt logfile entries to be generated. Also, if a website has frequently changing content or structure, then the older log data will be invalid when cross-referenced with the current website; although this can easily be remedied by keeping backups of each website version [9].
In addition to these limitations, technological barriers can undermine logging and the validity of its data: proxy servers, client-side caching, and robots. Proxy servers mask users' IP addresses, making distinct users indistinguishable [6]. This is easily addressed by asking users to login [10]. Client side caching saves previously visited webpages on the user's machine, then serves those saved pages to the user when they revisit the website, causing no entry to be made in the logfile [5]. This too is easily remedied by forcing web browsers to fetch a fresh copy, called 'cache busting' [11]. Robots (bots), spiders, and web crawlers are automated programs that visit websites to index them for search engines, or for potentially malicious reasons, e.g., spambots and botnets. These cause non-user-generated interactions to be recorded into the logfiles. Fortunately, robot interactions can usually be identified and ignored [12].
As a solution to some of the limitations and barriers of logfiles, JavaScript tracking, the addition of tracking code to every webpage, can be employed as an alternative method of tracking user interactions [13]. JavaScript tracking can be used to record the same information as logfiles, and in addition a host of other user interactions. These include mouse events, keystrokes, text selection; page scrolling, resizing the browser window, differentiating between users via HTTP cookies, and differentiating between a page opened in the same window and one opened in a new window. However, JavaScript tracking requires software code implementation, and data cannot be harvested immediately; time must be given for interaction data to be recorded. Also, users can disable JavaScript tracking if they delete their cookies, disable JavaScript, or block tracking. In addition, JavaScript tracking code slows down website performance because it transmits additional data, which can have a very negative impact on a website, e.g., increased load time can result in a loss of online sales.
The research described in this paper focuses on automatically generated web server logfiles due to the widespread availability of logfile data. The following describes other benefits of using logfiles.
2.1.2. Benefits of Logfiles
Table 1. Benefits of Logfiles described through their Properties.
|
Property |
Benefits |
|
1. Automatic Logging |
No set-up required: Logging is auto-enabled when a website is turned on [5]. Faithful depiction of usage: Interactions are recorded exactly as they happen, a benefit over usability testing, which relies on the accuracy of human memory. Holistic data: Interaction data is collected from all users of a website [5], therefore this data represents website usage of the whole population, unlike usability testing which uses a smaller and potentially less representative sample. Cost-effective: There is no additional cost to record user interactions or retrieve the data- a benefit over usability testing which is costly in terms of both of these. Can be used ad-hoc: As logfiles already exist on all websites, no planning is required to record and use interaction data. This is a benefit over usability testing, which requires planning of both. |
|
2. Server-side Logging |
No negative impact: As it is the host web server that records logfiles, logging has no performance or experience impact on users, their computers, or the website, unlike JavaScript tracking which slows website performance [5]. Depicts real usage: Users perform tasks to meet their own goals in their natural environments, with real contexts and constraints affecting them [5]. This is a benefit over usability testing, which often asks users to interact in a lab environment with artificially created tasks and contexts. |
|
3.Logging Standard |
Ubiquitous data: Most websites generate logfiles. |
|
4.Standard Formats |
Easy use of data: Logfiles come in standard formats. As a result parsing a logfile is simplified. |
|
5. IP address |
Geographic location: Users' geographic location can be identified from their IP address. Identifying users: As IP addresses are unique to a computer, distinguishing between users is simplified. |
|
6. Username |
Identifying users: Unique usernames can be used to identify and differentiate users. |
|
7. Timestamp |
Knowing task time: Each log entry is time-stamped, providing the task time and duration. |
|
8. Request |
What users are doing: As log entries details users' clicks, they provide information on the content accessed, navigated through the website, search terms and criteria used, and other inputs into the website. |
|
9. Referrer |
How users arrived: The referrer field depicts how users arrived at the website, e.g., whether they were using a search engine or were referred from an affiliate website. |
2.2. Web Analytics and Types of Analysis
Web analytics is "the measurement, collection, analysis and reporting of Internet data for the purpose of understanding and optimizing Web usage" [14] and makes use of logfile or JavaScript tracking data. The result of web analytics is typically reported through visualizations of website usage rather than raw numerical data. In other words, visualization is the primary way that raw logfile data is transformed into visual information. The likely reason for this is that visualizations present data "in forms allowing humans to exploit their innate visual analysis capabilities to interpret results" [15]. Techniques for analysing and visualizing/reporting web analytics data come in four flavours: frequency analysis, time analysis, exit analysis, and pattern analysis.
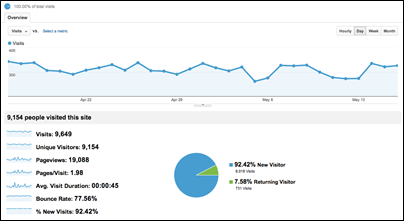
Frequency analysis looks at the frequency of user interactions and can reveal information about users' preferences and behaviour. For example, the frequency of a webpage's accesses (called page views) can demonstrate its value to users [16]. Frequency is calculated by simply tallying the number of times an interaction occurs. Tables and graphs are typically used to represent this data (see Figure 1). Another visualization technique for reporting frequency is called a heatmap where each clickable item on a webpage is overlaid with a visual indicator of the frequency of interaction, typically a colour block [9].
Time analysis looks at the amount of time spent on the website in a single visit and can indicate proficiency, the degree to which a particular webpage forces user cognition [13], or the interestingness (sic) of the content [16]. For example, if a user spends a large amount of time on a page that requires them to complete an action, this could mean that they are not proficient; the page requires a high degree of cognition [13]; or that the page is poorly designed [17]. Alternatively, this could indicate a large network latency, or that the user ceased interacting with the website and started a new task elsewhere. The amount of time a user spends on a content-abundant page can be used to determine its interestingness, defined as the affinity a user has for a particular web page or feature [16].
Regarding exit analysis, Kaushik [7] states that where a user exits a website can indicate their degree of success. For example, a user exiting on a content page relevant to their search criteria suggests that they found what they were looking for, whereas a user exiting on a help page suggests that the user did not find what they were looking for [7]. Bounce rate is a type of exit analysis depicting how often users visit and then leave a website without interacting with anything [7]. A high bounce rate signifies that the website is disappointing, and that value needs to be added in some way [7].
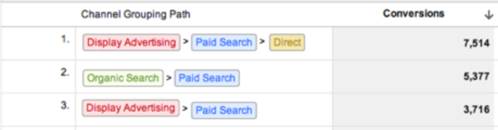
Pattern analysis aims to discover patterns within analytics data. Some of these patterns provide insights on past usage; others are predictive in nature [18]. Association rules, for example, determine the probability that Content B will be accessed with Content A (not time-ordered) and can be used to understand and predict usage patterns [19]. Pairing analysis determines how often users perform certain actions in a sequence (time-ordered), and can provide insight into UI elements and tasks that can be combined to improve efficiency [20]. Clustering involves discovering similar groups of users based on preferences or usage and can be used to provide personalization, e.g., Amazon.com's recommendation engine [21]. Path analysis or clickstream is a visualization technique using nodes and directed edges to depict common paths through a website (see Figure 2), and can be used to understand common navigation patterns [22].
Although web analytics collects and uses individual usage information, all of the above described techniques report quantitative generalization of website usage. These techniques fail to describe individual usage and behaviour vital to understanding website usability. This paper proposes an alternative technique for understanding website usability through logfiles:
- Extract user interactions captured in logfiles.
- Use the interactions to re-enact a user's progress through the Web UI, allowing a researcher to experience the user's visit from the user's perspective.
- Provide automated interpretation of the user's interactions and provide controls to help understand the user's experience, e.g. displaying the time spent per webpage, displaying a textual description of interactions, and providing controls to traverse back and forth through the interactions and visited pages.
To facilitate the above, a software tool, UX-Log, was developed to extract and recreate user experiences from logfiles with the goal of making these recreations available to usability expert for interpretation. This tool leveraged already existing logfiles, with the ability to interpret them from a usability perspective through the recreation of the user experiences. Unlike usability studies, this technique involves data from actual users and the ability to observe the user experience without being there and do so in an asynchronous manner, i.e., research done when needed and sometime after the original user experience.
3. Methodology
3.1. Design of UX-Log
UX-Log has two components: a back-end extractor and a front-end user interface for playing back the interactions. The backend takes a series of logfiles and parses out irrelevant information such as image, CSS, and JavaScript entries, as well as bot activity. The logfiles are then placed in a relational SQL database for efficient data storage and retrieval. Unique users are identified by their IP address and user login. A distinct visit is identified whenever there is a 15-minute or greater pause between interactions.
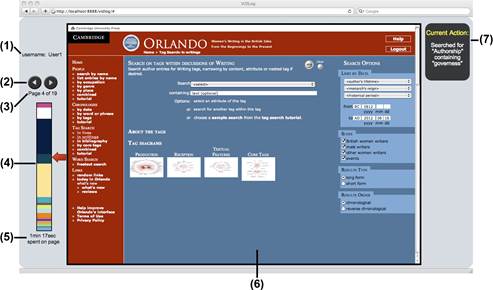
As seen in Figure 3, UX-Log's frond-end displays the pages a user visited in the order they were visited (6, 3 & 4); controls to navigate through the user-visited pages (2); the relative amount of time spent on each page (4 & 5); and the user's current interaction (7).
3.2. Study Design
In order to measure the success of UX-Log, the definition of usability provided in Section 1 was split into 4 types of insights: 1) understanding a user's goals; 2) understanding a user's strategies; 3) detecting a user's success or failure; and 4) understanding a user's proficiency.
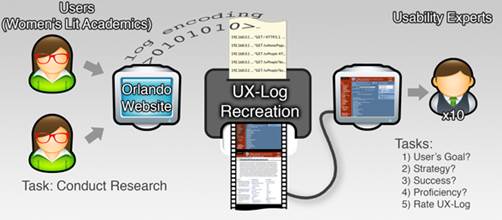
The protocol involved logging a novice and expert user performing specific tasks using the Orlando website (Orlando is an online tool for researching women's literature in the British Isles). The authors were familiar with the website and user tasks and as a result had a good understanding of the usability insights from the two sessions. To evaluate UX-Log, ten usability experts were asked to use UX-Log to gain usability insights from the UX-Log recreated sessions/experiences. Their insights were recorded and then compared to the actual experiences of the users.
In addition, the usability experts were asked to evaluate the effectiveness and perceived value of UX-Log - and by association, the user experience recreation from logfiles - for understanding website usability. The accuracy of their insights, as well as their rating of UX-Log, were used to evaluate the success of user experience recreation from logfiles. Figure 4 summarizes the study methodology.
Users: 2 female women's lit academics; one expert and one novice in Orlando.
(Mean age: 27, st.dev. 0.5)
Usability
Experts: 2 female and 8 male usability academics and practitioners.
(Mean age: 31, st.dev. 7.5)
4. Results and Discussion
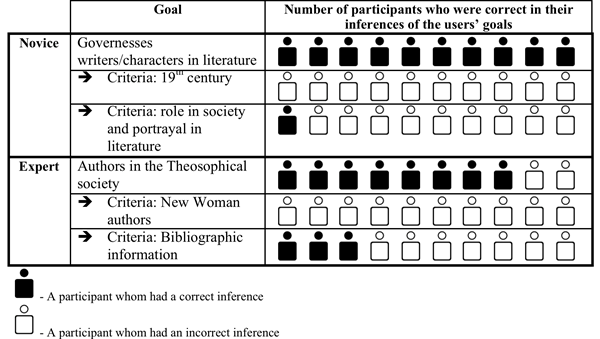
Users' goals were inferred as long as those goals were reflected in users' interactions with the website, e.g., if a search term used matched a goal. All the usability experts were able to infer that the novice user's goal was to research governesses since the term 'governess' was used in the search box, but none inferred that the novice was researching in the 19th century, as the novice did not input a desired date. Similarly, 8 of the 10 usability experts correctly inferred that the expert user was looking for 'authors in the Theosophical Society' since this was input into the search box. Only 3 inferred that the expert was searching for bibliographic information, as there was no direct evidence of this in the user's search terms. See Table 2 for details.
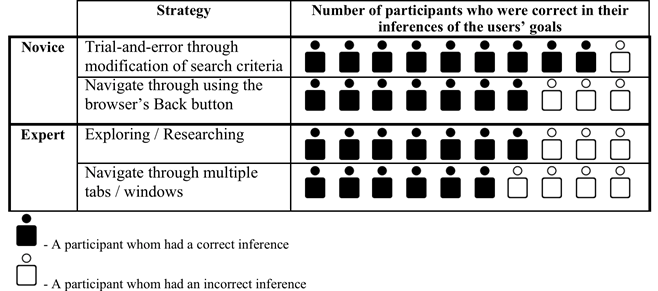
User strategy was successfully inferred by looking at the types of user interface elements used, e.g., the search and browsing capabilities. 9 of the 10 usability experts were able to infer that the novice's strategy was 'trial-and-error' through their repeated use of Search and the Back button. 7 usability experts were able to infer that the expert's strategy was 'researching' through their exploration of related-content. See Table 3 for details.
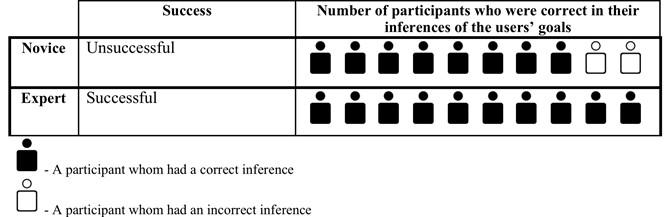
Successes and failures were accurately identified. However, ambiguous user behaviour such as sporadic browsing and trial-and-error tactics made for low confidence in determining whether the user was successful in reaching their goal. In addition, ambiguous interactions required a good deal of mental effort by the usability experts to understand what occurred. 8 of the 10 usability experts correctly inferred that the novice was unsuccessful, and all of the usability experts correctly inferred that the expert was successful. However, due to the ambiguous behaviour of the novice, usability experts were not confident of the novice's failure. Also, when the expert opened content in multiple browser tabs and windows, UX-Log could not convey this to the usability experts in a definitive manner. The usability experts struggled to comprehend this lack of clarity in the represented interactions, and as a result, their interpretation of the expert user's tab-switching behaviour was clouded and seen to be ambiguous. See Table 4 for details.
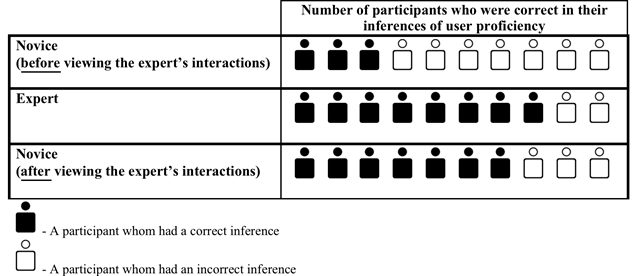
Finally, relative proficiencies between expert and novice users were determined, and accuracy of this determination improved once both users' recreations were viewed. After viewing the novice's user experience first, only 3 of the 10 usability experts accurately classified the novice as such. However, once the participants viewed the expert user (which always came second), 8 of them accurately classified the expert as such, and 7 correctly re-classified the novice as such. In addition, users' strategies and successes/failures helped indicate proficiencies. For example, trial-and-error behaviour suggested novice usage and success suggested expert usage. See Table 5 for details.
In rating UX-Log, 6 of the 10 usability experts responded positively for 'immersion into a user experience'; 6 responded positively for 'enjoyableness'; 7 responded positively for 'interestingness'; and 9 responded positively for 'utility for usability studies'. In part, the success of UX-Log can be attributed to its simple UI design, which proved to be easy to learn and understand. However, design feedback gained suggests UX-Log's user interface can be improved and as a result increase the effectiveness of both the tool and the technique of user experience recreation from logfiles. Specifically, additional textual description of user interactions and a better way to navigate through each user experience are needed enhancements.
4.1. Limitations
One expert and one novice user experience were used to evaluate the effectiveness of UX-Log. Without further work, it is unclear whether usability experts would have been able to determine the relative proficiencies of less contrasting user experiences; and whether UX-Log can be used to understand a more diverse range of users. Furthermore, the user experiences were presented to the usability experts always starting with the novice, making it unclear if the order of presentation had an affect on results.
As previously stated, usability experts received no training in UX-Log, the website, or the domain depicted in the user experiences. This is atypical of usability experts who would be familiar with all 3 areas before attempting to determine the usability of a website. This lack of training was due to the limited availability of our participants, but should be kept in mind when interpreting the results.
Although UX-Log was successful in understanding the usability of the Orlando website, this website did not impose barriers to logging a rich set of actions and states. The technique described in this paper may not be appropriate for websites with different setups such as those with purely dynamic content.
If another logging technique were to be used, such as JavaScript tracking, the raw data would be improved and this technique and tool would have fewer limitations.
4.2. Conclusions and Future Work
Overall, user experience recreation from logfiles and the UX-Log tool were successful for understanding website usability; not only were usability experts able to understand what users were doing, they were able to infer their goals, strategies, successes or failures, and proficiencies. To put this into context, they were able to do this without training in UX-Log, without familiarity of the website being evaluated (a research tool for women's literature), and without domain knowledge of the subject depicted in the user experiences (women's literature).
As this was a preliminary study and the first of its kind to investigate user experience recreation from logfiles, there are many opportunities for future work. Future research should focus on improving validity through use of a larger sample of users and proficiencies. In order to test user experience recreation in real-world contexts, participants should receive thorough training on the tool, domain, and website. Future research should also take the next step from understanding usability to evaluating usability by testing whether usability experts can identify usability issues via user experience recreation from logfiles. There are also opportunities to enhance logfile capture and user experience recreation through use of a hybrid logging technique (logfiles + JavaScript tracking). There is also opportunity to evaluate user experience recreation as a complement to usability testing, measuring the impact of this added data source on derived insights.
Future iterations of UX-Log should consider making UI enhancements to improve the usability and effectiveness of the tool itself. Suggested enhancements include controls to navigate non-linearly to any interaction in a user's experience; a full list of user interactions; webpage-highlighting of elements clicked and pre-population of user-inputted text; indicators of types of interactions; and indicators of repeated and notable actions.
The value of using UX-Log is that it is cost-effective, it requires few resources, it provides access to a wealth of user experience information, and it facilitates human-interpretation of machine-data. The outlined evolutions to the methodology and tool would provide greater insight into the effectiveness of user experience recreation from logfiles.
Acknowledgements
Professor Susan Brown, the curator of the website Orlando, unlocked its doors and provided its logfiles. This research would not have been possible without the support of SSHRC.
References
[1] The World Bank "Indicators" [Online] [Accessed 10 Jun. 2012]. Available at: View Website
[2] D. Evans "The Internet of Things, How the Next Evolution of the Internet is Changing Everything" [Online] [Accessed 10 Jun. 2012]. Available at: View Article
[3] ISO 9241-210:2010. "Ergonomics of human-system interaction - Part 210: Human-centred design for interactive systems" International Organization for Standardization, 2010. View Article
[4] J. Rubin, & R. Chisnell "Handbook of Usability Testing: How to Plan, Design, and Conduct Effective Tests" (2nd ed.). Wiley Publishing, Inc. Indianapolis, IN, USA. pp. 21 – 26, 2008. View Article
[5] J.I. Hong, J. Heer, S. Waterson, & J. Landay "WebQuilt: a framework for capturing and visualizing the web experience" WWW '01: Proceedings of the 10th international conference on World Wide Web. ACM. New York, NY, USA. 2001, pp. 717–724. View Article
[6] M. Burton, & J. Walther "The Value of Web Log Data in Use-Based Design and Testing", Journal of Computer-Mediated Communication, 6(3), 2001. View Article
[7] A. Kaushik "Web Analytics: An Hour A Day" Indianapolis, IN: Wiley Publishing, Inc. pp. 9, 152-154, 168-169, 201, 2007. View Book
[8] W3, "Logging Control in W3C httpd" July 1995 [Online] [Accessed 7 May 2012]. Available at: View Website
[9] T.A. Farney "Click Analytics: Visualizing Website Use Data" Information Technology & Libraries, 30(3), 2011, pp. 141–148. View Article
[10] The Apache Software Foundation, "Apache Module mod_ident" [Online] [Accessed 7 May 2012]. Available at: View Website
[11] R. Cooley, B. Mobasher, &J. Srivastava "Grouping Web page references into transactions for mining World Wide Web browsing patterns" Proceedings of the 1997 IEEE Knowledge and Data Engineering Exchange Workshop. IEEE Computer Society, 1997, pp. 2–9. View Article
[12] Y. Sun "A comprehensive study of the regulation and behavior of web crawlers" Doctor of Philosophy dissertation, the Pennsylvania State University, PA, USA, 2008. View Article
[13] R. Atterer, M. Wnuk, & A. Schmidt "Knowing the user's every move: User activity tracking for website usability evaluation and implicit interaction" Proceedings of the 15th international conference on WWW. ACM Press. 2006, pp. 203–212. View Article
[14] Digital Analytics Assocation "FAQ" [Online] [Accessed 7 May. 2012]. Available at: View Website
[15] D. Hilbert, & D. Redmiles "Extracting usability information from user interface events" ACM Computing Surveys, 32(4), 2000, pp. 384–421. View Article
[16] F. Tao, & K. Murtagh "Towards knowledge discovery from WWW log data" Proceedings of The International Conference on Information Technology: Coding and Computing (ITCC'00). IEEE Computer Society, 2000, pp. 302–308. View Article
[17] Measuring Usability, "Task Times in Formative Usability Tests" June 6, 2008. [Online] [Accessed 22 May. 2012]. Available at: View Website
[18] M. Gonzalez, J. Lores, & A. Granollers "Enhancing usability testing through datamining techniques: a novel approach to detecting usability problem patterns for a context of use" Information and software technology, 50(6), 2008, pp. 547–558. View Article
[19] R. Agrawal, T. Imielinski, & A. Swami "Mining association rules between sets of items in large databases" SIGMOD '93: Proceedings of the 1993 ACM SIGMOD International Conference on Management of Data. New York, NY, USA: ACM Press. Vol. 22(2), 1993, pp. 207–216. View Article
[20] M. Gray, A. Badre, & M. Guzdial "Visualizing usability log data" In INFOVIS '96: Proceedings of the 1996 IEEE Symposium on Information Visualization (INFOVIS '96). IEEE Computer Society. Washington, DC, USA. 1996, p. 93. View Article
[21] G. Xu, Y. Zhang, & X. Zhou "Discovering task-oriented usage pattern for web recommendation" Proceedings of the 17th Australasian DB Conference Australian Computer Society (ADC), Inc., '06. Darlinghurst, Australia. Vol. 49, 2006, pp. 167–174. View Article
[22] M. Khoo, J. Pagano, A.L. Washington, M. Recker, B. Palmer, & R.A. Donahue "Using web metrics to analyze digital libraries" JCDL '08: Proceedings of the 8th ACM/IEEE-CS joint conf. on Digital libraries, ACM, New York, NY, USA. 2008, pp. 375–384. View Article